Open to opportunities · STEM OPT Authorized

Data Governance & BI
for regulated industries.

MS Information Science · UW–Madison. I build audit-defensible data systems for compliance-heavy organizations — pharma, healthcare, supply chain — by translating between SQL, governance frameworks, and the boardroom. Most recently: AI-augmented third-party risk and controls testing workflows aligned to NIST · COSO · SOC 2.

6
live portfolio projects
100%
data integrity via SQL audit
−12%
billing dispute reduction
+20%
analytics-driven growth
Tech stack
SQLPythonClaude API TableauPower BISAP ERP Oracle ERPPydanticTPRM · GRC
Section · About Me

About Yiduo.

A translator between SQL schemas and boardroom decisions — currently focused on data governance, BI, IT-audit and third-party risk management for the New Jersey pharma corridor.

Yiduo Xiao
YX
Achievement Unlocked
🎓
MS Information Science · UW–Madison
STEM OPT · CIP 11.0401
📍
Edison · NJ
🌐
English (Professional) · 中文 (Native)
🏢
Lunarix Technologies LLC · Founder
YX · Data Governance & BI · Founder, Lunarix Technologies LLC

What I do, in one line

I build audit-defensible data systems for compliance-heavy organizations — pharma, healthcare, supply chain — by translating between SQL, governance frameworks, and the boardroom.

The longer version

I work at the intersection where data integrity meets human communication. By training, I'm a data and BI analyst. By instinct, I'm a translator — between engineers and executives, between SQL schemas and business stakes, between English and Chinese, between what the numbers technically say and what people actually need to decide.

My path is unusual. A Bachelor's in English literature in China, then a Master's in Information Science at UW–Madison. Most people read those as opposites. I read them as the same craft: the discipline of saying exactly what is true, with care for how it lands.

That's the through-line in my work. SQL audit trails. Segregation of Duties frameworks. ERP metadata governance. Executive-facing Tableau dashboards. These look like different things — they're really one question viewed from different angles: how do you build a system whose claims you can actually defend?

I've practiced this inside IBM's enterprise ERP consulting practice, inside a 5-stakeholder logistics operation in New Jersey, and inside my own company — Lunarix Technologies LLC — where I build analytics platforms for healthcare, pharma, and supply chain clients.

How I work

I think of my craft as having two modes. One that listens. One that builds. They're not separate hats — they're two ends of the same hand.

The listening mode is where I spend more time than most data people do. The questions a CFO asks at 9pm that no dashboard answers. The thing a process owner is too tired to articulate. The gap between what a stakeholder requests and what they're actually protecting. Most data work fails here, not in the SQL.

The building mode is where I refuse shortcuts. Clean schemas. Traceable logic. Audit-ready documentation. The kind of system where six months later, when someone asks "where did this number come from?", the answer is one click away. I'm allergic to data work that can't survive scrutiny.

The first mode is why stakeholders trust me. The second is why the auditor signs off.

A private framing My Vedic astrology calls these Moon and Mars — both sitting in my 3rd house of communication and craft. Listening + executing as a single instinct, not two separate ones. The chart is metaphor; the working pattern is real.

Right now

I'm focused on the data challenges facing New Jersey's pharma corridor — J&J, Merck, BMS, Sanofi. ESG performance tracking. Health equity gap analysis. GRC control frameworks. Problems where the data has to be right because the stakes are real — patient outcomes, regulatory exposure, board-level decisions.

In parallel, I'm preparing for the CISA certification (Certified Information Systems Auditor), and watching closely as AI systems enter the enterprise without the audit trails and controls we spent decades building for traditional software. That gap is going to define the next wave of enterprise risk. I want to be useful when it arrives — which is why I built TPRM Copilot, an AI-augmented third-party risk and controls testing engine that turns the audit-defensible patterns I've practiced into an agent pipeline. It lives at the intersection of the two things I care about: governance frameworks that survive scrutiny, and AI tooling that earns trust by showing its work.

Beyond the work

I read across systems I'm not formally trained in — Vedic astrology, energy work, contemplative traditions. Not as escape from rigor, but as a complement to it. Some of the best frameworks for understanding people, timing, and pattern weren't written in PDFs after 1950.

I keep a small, deliberate circle. I write in two languages. I'm building slowly and on purpose, because the work I'm interested in compounds, and short-term wins rarely do.

If we share a sense that clarity is care — that the most respectful thing you can do for someone is tell them the truth in a form they can use — we'll probably get along.

Section · Projects

Selected work.

Six governance-first builds spanning AI-augmented audit agents, third-party risk assessment, pharma ESG analytics, and ERP-grounded GRC frameworks. Each ships with a live deliverable, a quantified outcome, and traceable evidence.

01

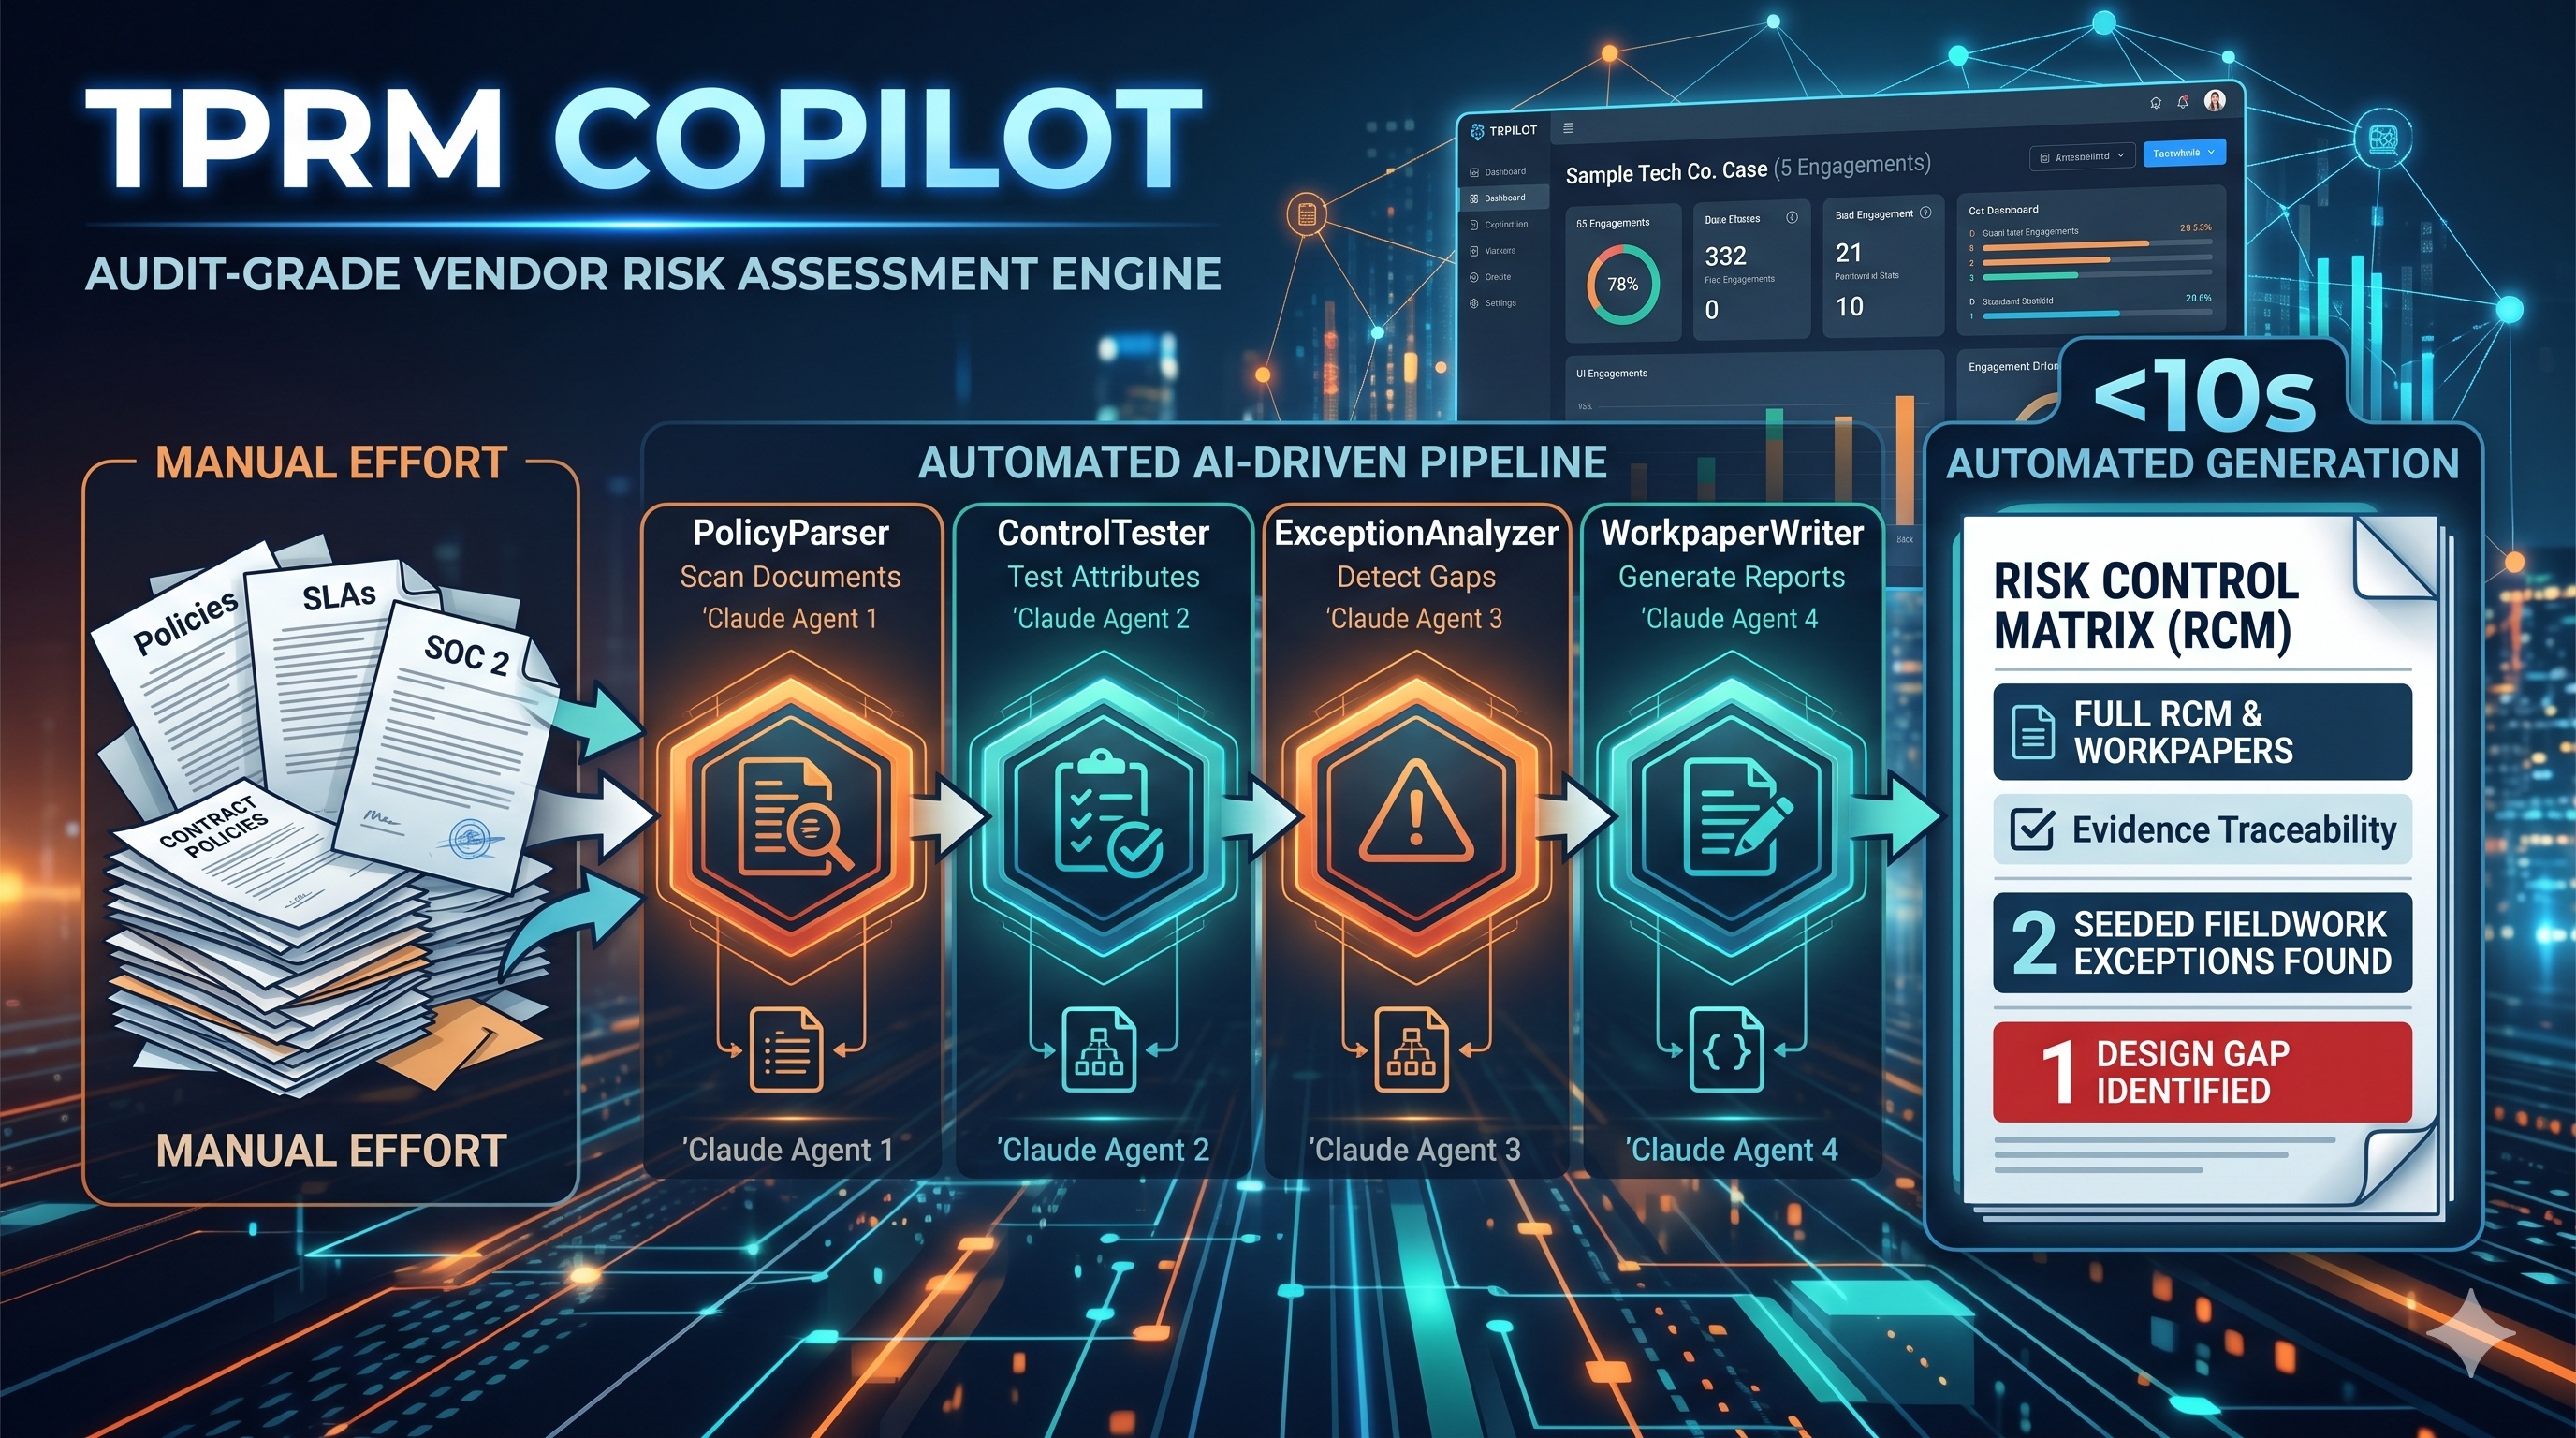
TPRM Copilot — Audit-Grade Vendor Risk Assessment Engine

TPRM · GRC · AI Agent
TPRM Copilot architecture diagram
01
About this project

Problem: Modern TPRM teams spend days reading vendor policies, walking samples through every control attribute, and writing up findings — work that scales poorly as vendor portfolios grow. Approach: A pipeline of four scoped Claude agents — PolicyParser → ControlsTester → ExceptionAnalyzer → WorkpaperWriter — each returning a typed Pydantic object. LLM proposes reasoning; deterministic Python writes the audit-defensible workpaper layout. Outcome: End-to-end Risk Control Matrix in <10s. On the bundled Sample Tech Co. case (5 vendor engagements), surfaces 2 seeded fieldwork exceptions + 1 design gap with full evidence traceability. Ships with --demo mode for offline / CI runs.

Data summary
Agents in pipeline4
Controls inventoried7 (C1–C7)
Findings auto-generated3 (F-1, F-2, F-3)
Deviation rate detected40%
StackClaude API · Pydantic · openpyxl
02

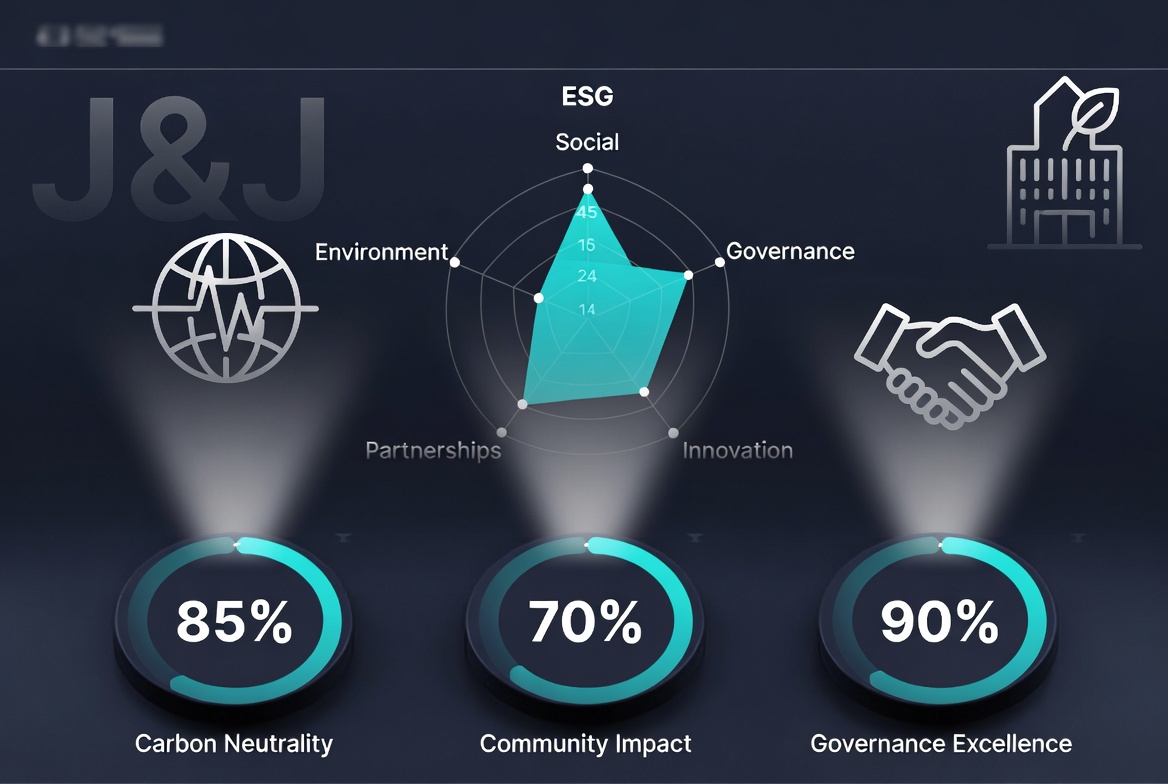
J&J Health for Humanity — ESG Goals Tracker

ESG · Pharma
J&J ESG Tracker dashboard
01
About this project

Problem: J&J publishes 5 Health for Humanity goals across carbon, packaging, water, supplier sustainability — but no single view reconciles them against peer pharma. Approach: SQL schema ingesting CDP + SEC EDGAR + EPA disclosures; Python ETL; Chart.js dashboard with year filter, net-zero pathway overlay, and Merck/BMS/Pfizer benchmarking. Outcome: Live dashboard surfaces J&J's largest decarbonization gap (Scope 3 supplier emissions) and quantifies progress against 2030 targets — usable for ESG-team baseline review.

Data summary
ESG goals tracked5
Years of trajectory2019–2023
Peer benchmarksMerck · BMS · Pfizer
Pipeline stagesSQL → ETL → Viz
Disclosure assurance3rd-party
03

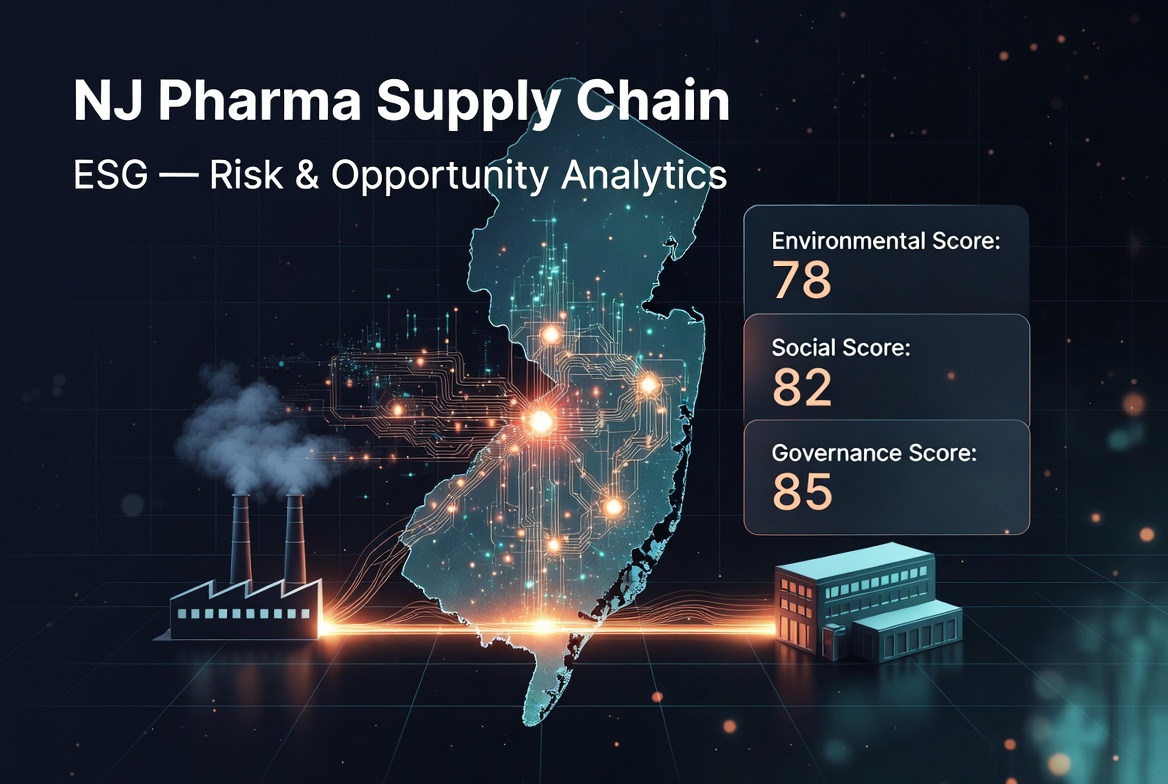
NJ Pharma Supply Chain ESG — Risk & Opportunity Analytics

Supply chain · ESG
NJ Pharma Supply Chain ESG dashboard
02
About this project

Problem: NJ pharma cluster outperforms market on ESG, but 82% of carbon footprint sits with upstream suppliers — and there's no consolidated view of where supply-chain risk actually concentrates. Approach: TCFD-aligned 5×5 likelihood × impact matrix across 6 supply-chain stages × 5 risk types; Scope 1–3 emissions trend; SASB-weighted ESG composite for 6 NJ-HQ pharma cos. Outcome: Surfaces three critical hotspots (API sourcing × geopolitical / × Scope 3 / × environmental) and pairs each material risk with quantified opportunity — $80–140M carbon exposure offset paths.

Data summary
NJ pharma covered6 companies
Risk matrix cells30 (6×5)
Scope 3 share82%
SBTi-validated5 / 6
FrameworksTCFD · SASB · PSCI
04

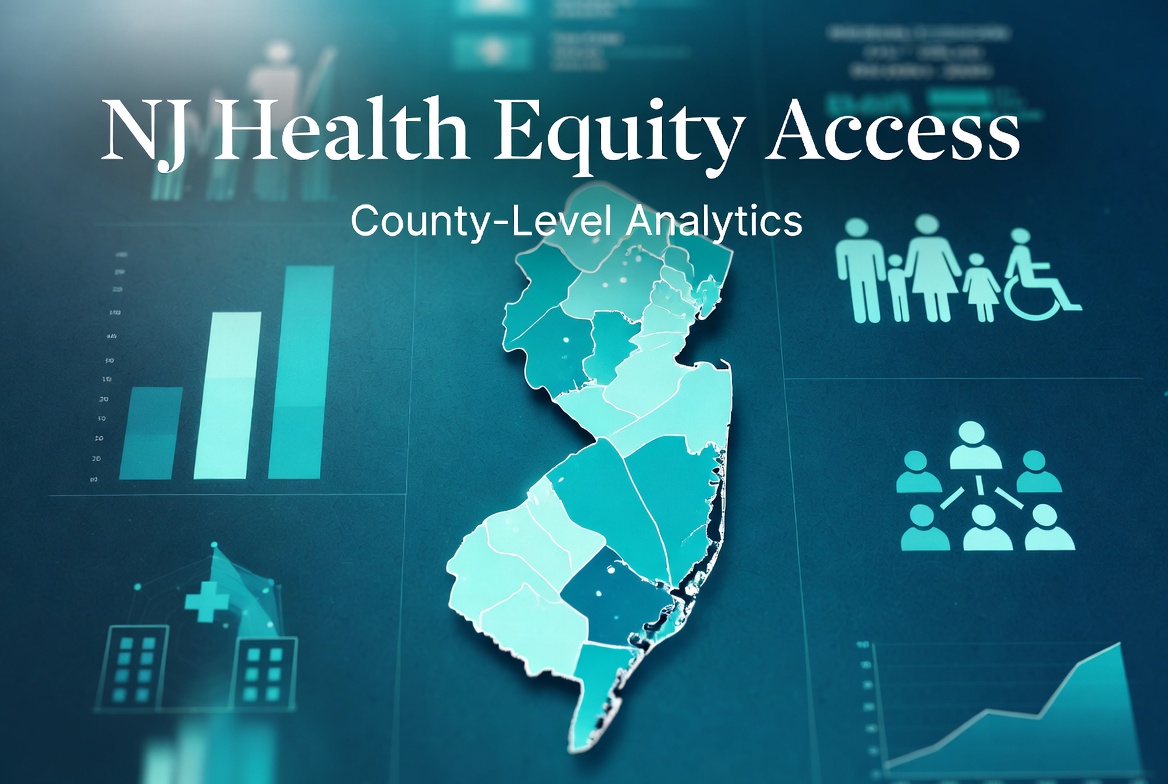
NJ Health Equity Access — County-Level Analytics

Health equity
NJ Health Equity dashboard
03
About this project

Problem: J&J's Race to Health Equity pillar needs county-granularity disparity data, not state averages. Approach: SQL schema joining CDC PLACES + US Census ACS + HRSA + NJ DOH; computed Black–White and Hispanic–White uninsured gaps per county; layered chronic disease burden + provider access (HPSA). Outcome: Interactive tile-map of 21 NJ counties with a J&J market opportunity score — identifies which counties offer both highest unmet need and program-deployment feasibility. Direct input for ESG investment prioritization.

Data summary
NJ counties21
Public data sources4
Disparity metrics3 (race × income × access)
Crisis counties flagged4
OutputTile-map + opp. score
05

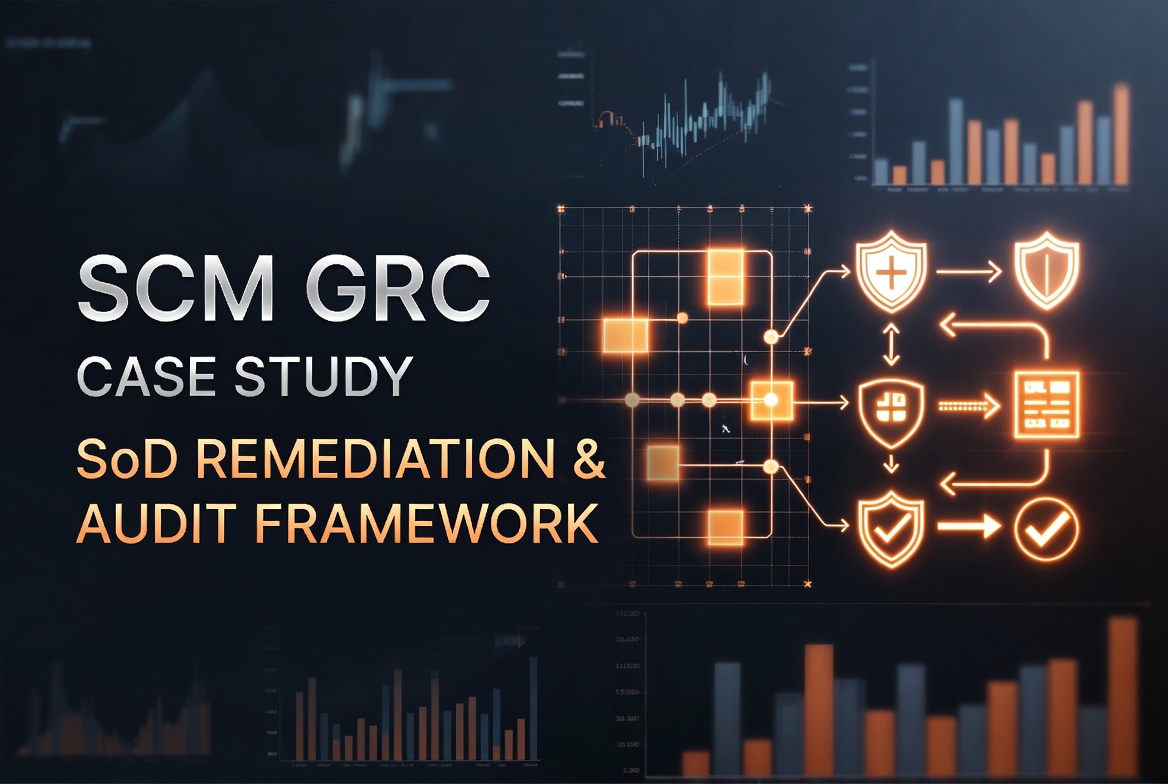
SCM GRC Case Study — SoD Remediation & Audit Framework

GRC · Data Governance
SCM GRC Case Study
04
About this project

Problem: Live 8-month GRC implementation in a 5-stakeholder logistics operation. Dispatch coordinator was negotiating rates AND approving payments — textbook SoD violation creating ~$28K/month unchecked exposure. Approach: COSO 17-principle mapping; ERP role redesign; counter-signature workflow; SQL audit trail; COBIT 2019 maturity uplift across 8 processes. Outcome: 4/4 SoD conflicts remediated, −74% average risk reduction, −12% billing disputes, 100% asset recovery on 3 insurance claims. Framework structurally analogous to 21 CFR Part 11 pharma data integrity.

Data summary
SoD conflicts4 / 4 remediated
Avg risk reduction−74%
Billing dispute Δ−12%
CMM uplift1.0 → 3.5
FrameworksCOSO · COBIT · IIA
06

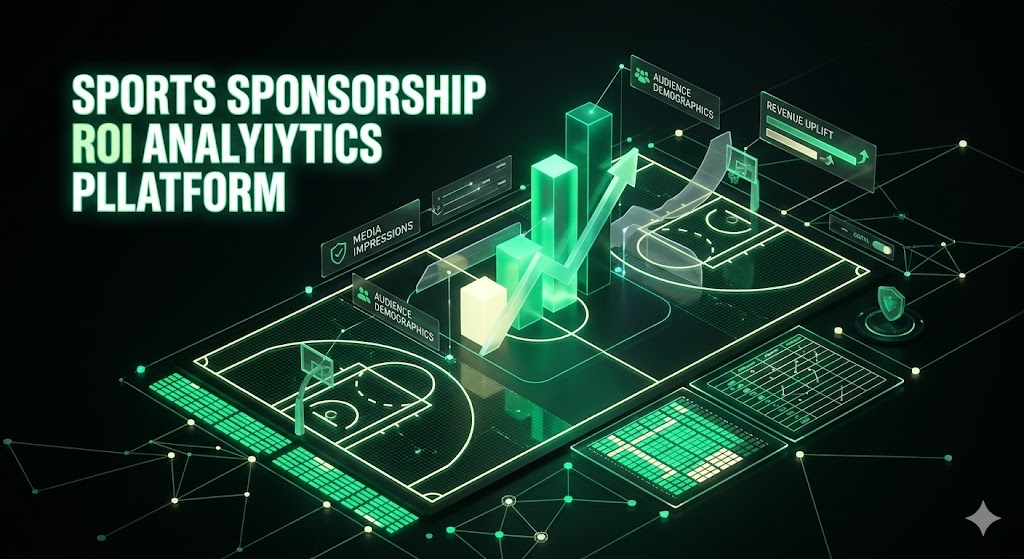
Sports Sponsorship ROI Analytics Platform

BI · Data engineering
Sports Sponsorship ROI
05
About this project

Problem: Sponsorship portfolios are measured anecdotally — gut feel on what's working. Need an attribution layer connecting media value, audience engagement, and revenue. Approach: SQL data model linking sponsorship spend → media impressions → audience demographics → revenue uplift; Python ETL pipeline; Tableau executive dashboard with three lenses (portfolio, partner, event). Outcome: Full SQL→Viz pipeline live, producing per-sponsor ROI multipliers and surfacing under-performing partnerships for renegotiation. Ongoing — initial 3 dashboard views in production.

Data summary
Dashboard views3
PipelineSQL → Python → Tableau
Attribution layers3 (media · audience · revenue)
StatusIn production
OwnerLunarix Technologies
Section · Capabilities

Skills & certifications.

The full data-governance + BI stack — from SQL modeling and ETL pipelines to executive dashboards and audit frameworks.

01 · BI
Business Intelligence
Tableau · Power BI · Excel
Executive dashboards · KPI design
Data storytelling
02 · DE
Data Engineering & SQL
SQL (advanced) · Python · ETL
Data modeling · Audit trails
Schema versioning · Pipeline automation
03 · ERP
ERP & Data Governance
SAP ERP · Oracle ERP
Lingxing WMS · SoD controls
COSO · COBIT · IIA 3 Lines
04 · ML
Analytics & ML
Python · Statistics · A/B testing
Customer segmentation
Supervised ML · Algorithms
05 · ESG
ESG & Compliance
TCFD · SASB · PSCI · SBTi
21 CFR Part 11 / GxP awareness
CDP · MSCI ESG · Scope 1-3
06 · COM
Communication & Writing
Technical documentation
English (Professional) · 中文 (Native)
Executive-ready reporting
Section · Contact

Let's work together.

Currently seeking BI Analyst, Data Analyst, or IT Audit Analyst roles in NJ pharma / healthcare. Available immediately · Open to full-time, contractor, and hybrid arrangements.

STEM OPT Authorized · CIP 11.0401 · J&J H-1B pipeline eligible